Open
Description
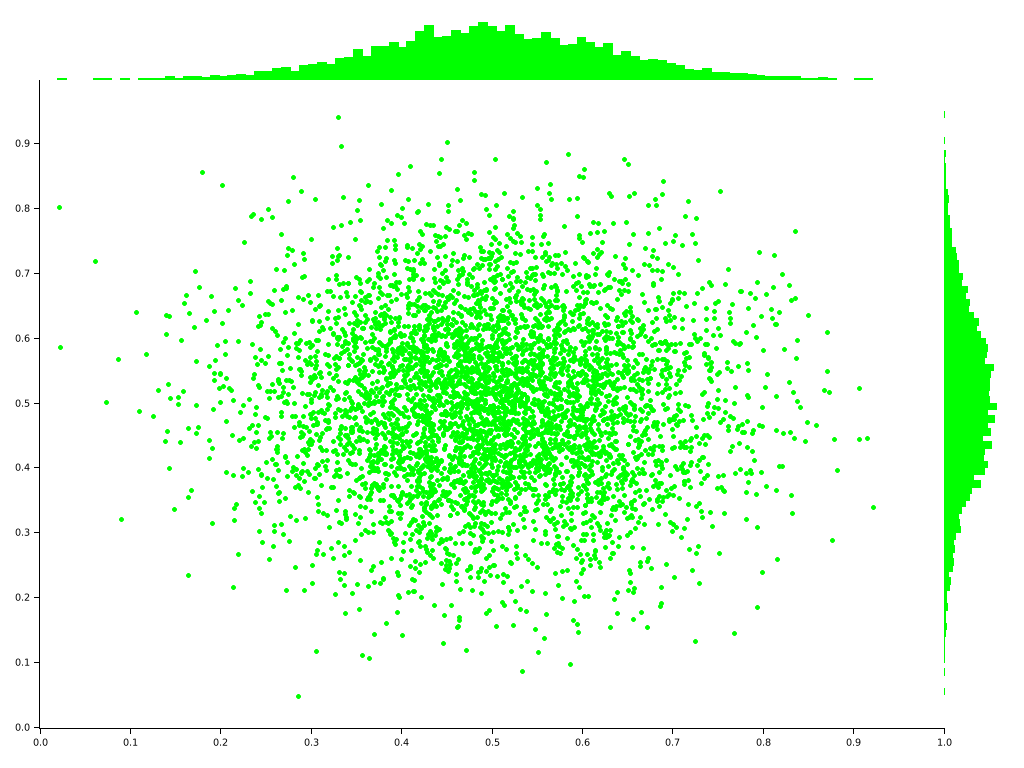
What is the feature ?
To show data density by creating lines on top of axis lines.
(Optional) Why this feature is useful and how people would use the feature ?
A simpler/ compact way to show data density compared to adding histogram on both x-axis and y-axis. At the moment, the scaling is very challenging, particularly with margin.
(Optional) Additional Information
Compact/ easier way of showing data density compared to histogram on both axis.
Thanks for continuing the good work.
Activity
humphreylee commentedon Sep 27, 2023
Renamed the feature request to Rug plot
[-][Feature Request] hlines and vlines (horizontal and vertical lines[/-][+][Feature Request] Rug Plot[/+][-][Feature Request] Rug Plot[/-][+][Feature Request] Rug plot[/+]